TikTok Ads Statistics 2026: Benchmarks, Rates and Performance Data

June 19, 2026
7 min red
This is some text inside of a div block.

TikTok is no longer just a platform where trends are born. It has become one of the fastest-growing advertising channels in digital marketing. TikTok's global ad revenue is projected to exceed $43 billion.

For marketers, that shift matters. Budgets are moving. Brands are scaling. And competition for attention on TikTok is growing every quarter.

But knowing the platform is popular is not enough. To make smart advertising decisions, you need real data. What does a good CTR look like? What are realistic ROAS expectations? Which industries are actually performing?

We break down the most important TikTok ads statistics for 2026, covering benchmarks, ad rates, engagement data, audience reach, and industry performance across key niches.

Whether you are just getting started or looking to improve existing results, this data gives you a clear picture of what works, what does not, and where the real opportunities are in 2026.

TikTok Advertising
Scale Your TikTok Ads Without Limits

Join 8.7M+ businesses on TikTok ads. Uproas gives you enterprise-level agency ad accounts with higher spend limits and fewer restrictions.


Get Your TikTok Agency Account →

TikTok Advertising Stats: The Big Picture in 2026

TikTok’s advertising ecosystem has grown rapidly over the past few years. As a result, TikTok has turned into a serious competitor to traditional digital ad giants.

TikTok Advertising Stats: The Big Picture in 2026

Let’s look at what TikTok advertising stats show about the platform.

TikTok's Global Ad Revenue Growth (2024-2026)

TikTok’s ad revenue has scaled aggressively, driven by increased advertiser demand and strong engagement rates.

  • In 2024, TikTok generated an estimated ~$23 billion in ad revenue
  • In 2025, TikTok’s ad revenue reached around $32.8 billion.
  • For 2026, estimates indicate revenue could reach ~$43.96 billion+, continuing its upward trajectory
Ad Revenue Growth
Projected to exceed $43.96B in 2026 and reach $53.95B in 2027
$2B
2020
$4B
2021
$11.6B
2022
$18B
2023
$23.6B
2024
$32.8B
2025
$44B
2026*
$54B
2027*
Actual
* Estimated / Projected

Based on TikTok ads statistics, it’s now firmly in the top tier of global ad platforms, with sustained double-digit growth.

Need help setting up TikTok Pixel? We got you!

How Many Advertisers Are on TikTok in 2026?

Exact advertiser counts are not publicly disclosed. But growth trends are clear:

  • TikTok’s advertiser base has expanded rapidly as brands shift budgets toward short-form video.
  • The platform has seen continuous year-over-year growth in advertiser adoption, especially among SMBs and e-commerce brands.
  • Major global brands like Amazon, Pepsi, and Apple are among top spenders on TikTok ads.
  • TikTok Shop has over 15 million sellers active globally in 2026.
  • There are 8.7 million businesses that actively run paid ads on TikTok.
How Many Advertisers Are on TikTok in 2026?

Want to learn about Native Advertising? It can boost your revenue to a whole new level.

TikTok Ad Performance by Format (CPM, CPC, CTR)

Performance by Format
TikTok Ad Format Benchmarks 2026
Ad Format Avg CPM Avg CPC Avg CTR
In-Feed Ads $5.20 $0.72 1.62%
TopView Premium $14.80 $1.40 2.87%
Spark Ads $4.90 $0.64 2.21%
TikTok Shop Ads $9.40 $1.12 2.46%
Branded Hashtag Challenge Top CTR $8.60 $0.94 3.18%
Branded Effects $7.20 $0.88 1.94%
Search Ads beta $6.80 $0.91 2.08%
Source: Digitalapplied

TikTok is no longer experimental. It's a mainstream advertising channel used by both global brands and smaller businesses.

TikTok's Share of Global Digital Ad Spend in 2026

TikTok is steadily capturing a larger portion of global ad budgets:

  • TikTok is now considered one of the fastest-growing digital ad platforms, taking share from traditional social and display channels
  • While still behind Google and Meta, TikTok is closing the gap due to stronger engagement and social commerce growth
  • Global advertising spend will reach $1.25 trillion in 2026 as digital channels take the dominant share.

TikTok’s share of ad spend is rising because it combines entertainment, discovery, and conversion in one platform.

Audience Reach: Who Can You Target With TikTok Ads in 2026?

Audience Reach in 2026
1.9B
Global Users
98
Min/Day per User
30%
of Global Social Users
49%
Use TikTok as Search Engine

  • TikTok’s reach is one of its biggest advantages for advertisers
  • TikTok has around 1.9B global users as of 2026.
  • Users spend an average of 98 minutes per day on the platform.
  • TikTok reaches ~30.27% of global social media users.
  • About 49% of consumers now use TikTok like a search engine.
Audience Reach: Who Can You Target With TikTok Ads in 2026?
Regional Data
TikTok Brand Reach Benchmarks by Region
Region Min. Reach Required Higher Ad Recall Higher Awareness Higher Purchase Intent
Asia-Pacific 50% $0.23 18% 0.19
Europe & Israel 40% $0.23 21% 0.28
Latin America 40% $0.21 23% 0.21
Middle East & Africa 50% $0.21 33% Highest 0.19
North America 40% $0.23 26% 0.27

Audience Demographics & Maturity Trends

TikTokers always follow the trends and demographics of the audience. TikTok ads statistics strongly back this data.

Demographics (broad trends)

  • The platform was originally dominated by Gen Z, but is now expanding into Millennials and older age groups.
  • Strong presence in:
    • Asia
    • Europe
    • Latin America
Audience Demographics & Maturity Trends

How the Audience Has Matured

  • TikTok is no longer just a “young audience” platform.
  • Growth is now driven by:
    • Older users joining.
    • Increased use for shopping and product discovery.
    • Broader content categories beyond entertainment.

Key Takeaway

  • TikTok’s ad revenue is now $32B+ and growing fast.
  • Advertiser adoption continues to rise across all business sizes.
  • Its share of digital ad spend is increasing year by year.
  • And its audience has expanded far beyond Gen Z.

In 2026, TikTok is not just a social platform; rather, it’s a core advertising channel competing with the biggest players in digital marketing.

Need help with ads? Get enterprise level agency ad accounts for TikTok!

Are TikTok Ads Effective in 2026? Here’s What the Data Says

As a social platform, TikTok has seen impressive growth. But the real question is - Do TikTok ads actually perform?

Are TikTok Ads Effective in 2026? Here’s What the Data Says

The short answer is yes. However, performance depends heavily on creativity, targeting, and setup. 

Here’s what the latest data shows. Let's check the stats that will answer your concern regarding are TikTok ads effective or not.

TikTok Ads Engagement Rate

TikTok continues to outperform most social platforms in engagement.

TikTok Engagement Rate by Industry

Engagement Data
Industry Avg Engagement Rate Visual
Schools & Sports Teams 9.5% / 4.2%
Higher Education 9.23%
Drinks 7.69%
FMCG Food 6.92%
Travel 5.23%
Home Living 4.76%
Arts & Crafts 4.54%
Jewelry 4.01%
Beauty 3.48%
Fashion 2.51%
Platform Average 4.07%
Source: Brandwatch

TikTok Engagement Rate by Follower Count

Influencer Benchmarks
Influencer Tier Follower Range Good Engagement Rate
Nano 1,000 to 10,000 10%+
Micro 10,000 to 100,000 6 to 8%
Macro 100,000 to 1,000,000 5 to 7%
Mega / Celebrity 1,000,000+ 4 to 6%
Brands (general) All sizes 3 to 5%

Brand Recall & Purchase Intent Statistics in 2026

TikTok has also proven strong in brand impact and conversion influence. According to TikTok for Business data:

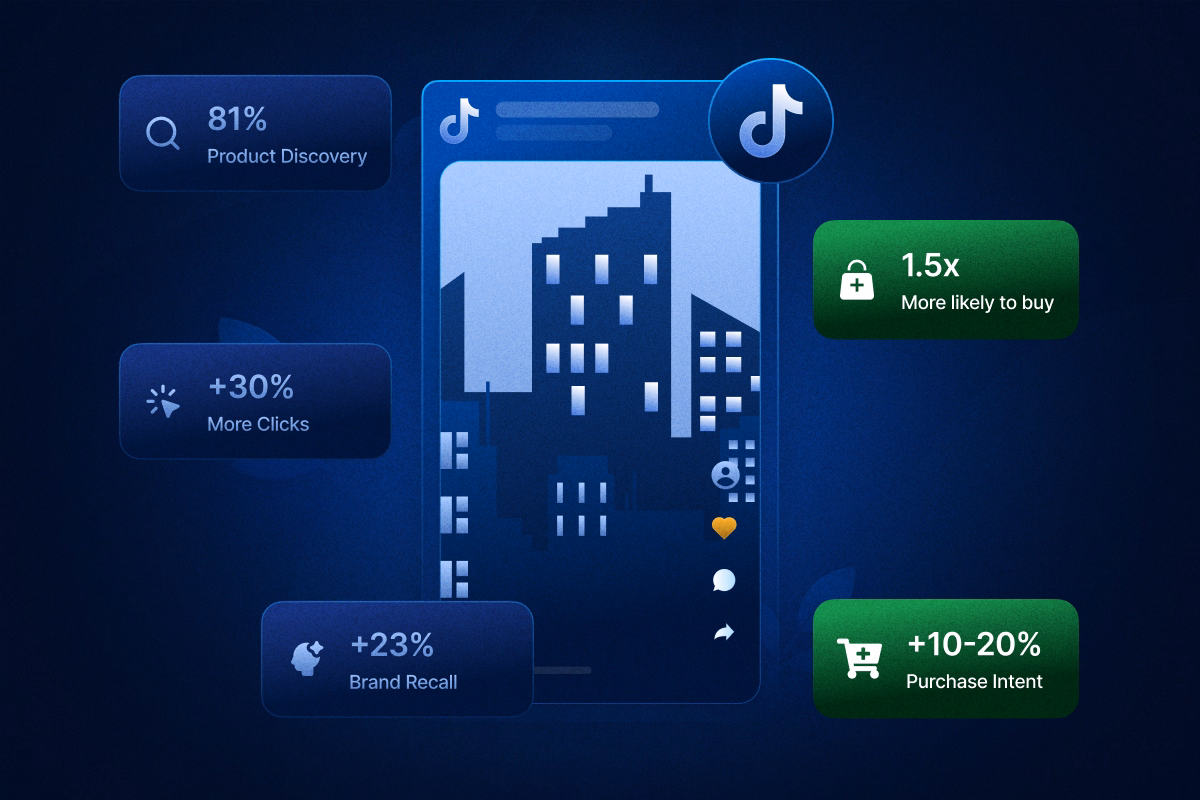
  • Ads on TikTok can drive up to +23% higher ad recall vs. other platforms.
  • TikTok brand lift studies show campaigns can drive double-digit increases in purchase intent, often ranging from 10% to 20%+, depending on creative and targeting.
  • As of early 2025, 81% of TikTok users discover new products and brands directly through the platform. 
  • TikTok users are 1.5× more likely to buy something they discovered on the platform immediately.
  • Video ads get up to 30% more clicks than static ads (image ads) for the same cost. 
Brand Recall & Purchase Intent Statistics in 2026

TikTok video completion rates are often higher than traditional social video formats, especially for short-form ads. 

Brand Impact Data
TikTok Ads Brand Performance 2026
+23%
Higher Ad Recall vs other platforms
10-20%
Increase in Purchase Intent from brand lift
81%
of users discover new brands on TikTok
1.5x
More likely to buy immediately after discovery
+30%
More clicks vs static ads at same cost
Higher
Video completion rates vs traditional social video

Got banned from TikTok? Here’s how to get unbanned!

Conversion Rate Benchmarks by Industry in 2026

Conversion performance varies by industry, and TikTok does not publish fixed global CVR benchmarks. However, performance trends from platform insights and industry reports show:

  • eCommerce: Advertisers see strong conversion performance, especially with visual products and retargeting campaigns.
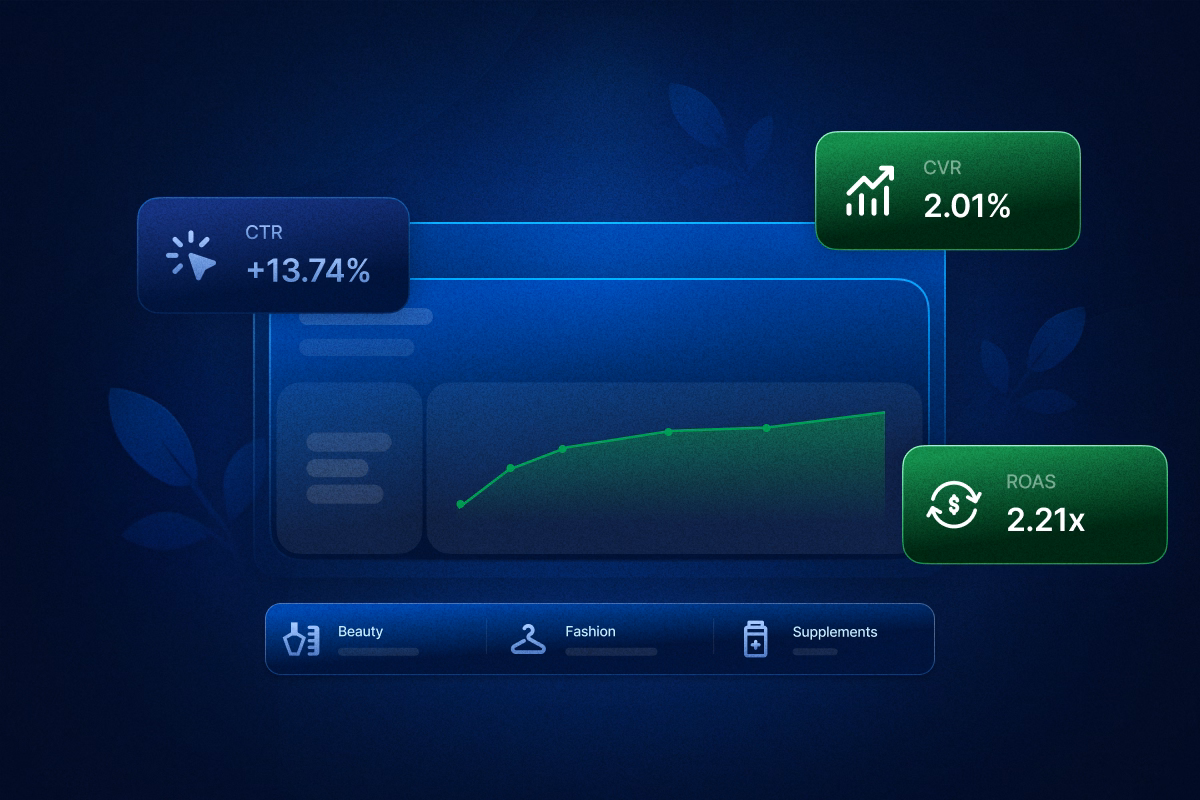
  • Average Conversion Rate (CVR): ~2.01% (following a 6.2% decline from 2025)
  • Industry Leaders (High Conversion): Beauty & Health (high purchase intent), Fashion & Accessories, and Food Supplements
  • Average CTR Improvement: +13.74%, indicating users are clicking more, though converting at a slightly lower rate
  • Average ROAS: ~2.21, with higher ranges (4:1-7:1) achieved in Beauty and Fashion
  • Top-Performing Content: 7-15 second videos.
  • Lead generation: Results are more variable, depending on offer clarity and landing page experience.
  • App installs: Performance is high in gaming and fintech, driven by short-form video engagement.
Conversion Rate Benchmarks by Industry in 2026

Overall Benchmarks for TikTok Ads

Year-over-Year Comparison
TikTok Ads Overall Benchmarks: 2024 vs 2025
Metric 2025 2024 Trend
CPA $32.74 $30.14 Up
CPM $13.26 $11.43 Up
CVR 2.00% 2.15% Down
ROAS 2.21 2.34 Down
AOV $74.12 $72.19 Up
CTR 1.77% 1.56% Up
MER 0.39 0.37 Up

Industries seeing the strongest ROI:

  • Fashion & beauty
  • Consumer electronics
  • Home & lifestyle
  • Mobile apps (especially gaming)

These categories benefit from:

  • Visual storytelling
  • Impulse buying behavior
  • Trend-driven discovery

When TikTok Ads Don’t Work: Limitations in 2026

TikTok ads are effective, but not universally. Here are the key limitations:

Audience Mismatch Issues

TikTok’s audience has matured, but some segments still underperform:

  • Older B2B decision-makers
  • Niche enterprise audiences
  • Highly technical or low-visual products

TikTok is still strongest for:

  • Consumer-facing brands
  • Visually engaging products
When TikTok Ads Don’t Work: Limitations in 2026

Creative Fatigue

TikTok users consume content fast and, subsequently, get bored fast. Short-form content also means faster ad fatigue than on Facebook or YouTube.

In practice:

  • Creatives may need refreshing every 7-14 days
  • Repetition leads to a rapid drop in engagement

Budget & Learning Phase Constraints

TikTok’s algorithm needs data to optimize. Campaigns often require consistent daily spend to exit the learning phase.

Without enough budget:

  • Ads may remain “active but not spending.”
  • Delivery becomes inconsistent.

Platform Uncertainty & Policy Changes

TikTok has faced regulatory scrutiny in multiple regions. Ongoing discussions around data privacy and platform restrictions have created uncertainty for some advertisers. These discussions have also influenced long-term budget planning.

Key Takeaway

  • TikTok leads in engagement and attention.
  • Shows strong performance in brand recall and purchase intent.
  • Conversion rates are improving, especially in e-commerce.
  • But success depends on creative quality, budget, and audience fit.

In 2026, TikTok ads will be highly effective. But as an advertiser, you need to adapt to how the platform actually works.

TikTok Ads Benchmarks 2026

Benchmarks matter because they tell you whether your campaigns are actually performing or just spending. Here’s what TikTok ads benchmarks look like in 2026.

TikTok Click-Through Rate (CTR) Benchmarks in 2026

Let’s first see the CTR benchmarks by ad format:

Average TikTok CTR
~0.84%
Source: WebFX
In-Feed Ads CTR
~0.5% - 1.0%
Source: Tlinky
TopView Ads CTR
~12% - 16%
Premium placement, higher visibility
Source: WebFX
Spark Ads CTR
~1.5% - 3.0%+
Native content boost format
Source: Tlinky

TikTok Conversion Rate (CVR) Benchmarks in 2026

CVR for eCommerce Campaigns

Conversion Rate Benchmarks
TikTok Overall / Standard
0.5% to 5%
Typical range for standard discovery-based campaigns
Source: Shopify
TikTok eCommerce (General)
2.01%
Standard performance across specialized retail tools
Source: Triple Whale
Conversion-Optimized Ads
~1.92%
Average for ads specifically optimized for lower-funnel actions
Source: Lebesgue

CVR for Lead Generation Campaigns

Lead Generation CVR
Standard Ads
2% to 3%
TikTok Lead Gen average for standard ads
Source: Sovran
High-Performing Ads
4% to 5%
Reaches 4% to 5% for high-performing ads
Source: Sovran
TikTok Shop Integration
N/A
Does not apply to TikTok Shop integration
Source: Sovran

CVR for App Install & Specialized Campaigns

TikTok Shop CVR
10%+
Conversion Rate
TikTok Shop Campaigns
The frictionless in-app checkout process drives the strongest performance at 10% or higher.
Source: Creatify

TikTok CPM Benchmarks in 2026 (Cost Per 1,000 Impressions)

TikTok Ad Costs at a Glance
Cost Per Click
$0.30 to $1.50
Click costs for TikTok campaigns range from $0.30 to $1.50
Source: WordStream
CPM (per 1,000 impressions)
$4 to $10
Advertisers pay between $4 and $10 for every 1,000 impressions
 
Cost Per Video View
$0.01 to $0.07
Individual video views typically cost between $0.01 and $0.07
 

TikTok CPC (Cost Per Click) Benchmarks in 2026 

Average TikTok CPC: ~$1.00

Platform CPC Comparison
Average Cost Per Click: TikTok vs Competitors 2026
TikTok
~$1.00
Middle
Facebook
$1.92
Highest
Instagram
$0.40-0.70
Lowest
TikTok sits in the middle. It can be cheaper than Meta in some cases while offering stronger engagement rates.

TikTok sits in the middle. It’s cheaper than Meta in some cases and more expensive than Shorts.

TikTok Engagement Metrics by Account Size (2024 vs 2025)

Engagement Growth Data
TikTok Engagement by Account Size: 2024 vs 2025
Account Size Likes 2024 Likes 2025 Comments 2024 Comments 2025 Shares 2024 Shares 2025 Views 2024 Views 2025
1K - 5K 320 330 7 8 35 40 860 350
5K - 10K 575 595 10 15 38 60 1,575 945
10K - 50K 1,225 1,325 23 25 95 120 3,655 3,240
50K - 100K 2,177 2,675 37 40 135 200 8,688 9,900
100K - 1M 6,402 7,900 90 100 330 477 25,198 34,900
Source: SocialInsider

Year-over-year Changes (2024-2025)

Year-over-Year Shifts
TikTok Engagement: 2024 to 2025 Changes
+9%
Likes
All tiers grew
+3%
Comments
1M+ up +11%
+13%
Shares
Large accts +44%
-23%
Views
Small accts hit hardest
+9%
Eng. Rate
3.85% to 4.20%

TikTok Ads by Industry in 2026: Which Niches Get the Best Results?

Not every industry performs equally on TikTok. The platform rewards visual storytelling, impulse-driven buying, and entertainment-first content, which means some niches naturally outperform others.

TikTok reports that entertainment-led and creator-style ads significantly outperform traditional ads.

Industry-Specific CTR and ROAS Data for 2026

While exact performance varies, here are realistic 2026 benchmark ranges:

CTR by Industry

Industry Median CTR
Electronics 1%
Apparel & Accessories 1%
Home & Garden 1%
Beauty 0.58%
Food & Beverage 0.58%
Toys, Art, & Collectibles 0.58%
Lifestyle & Boutique 0.57%
Health & Wellness 0.57%
Sports & Outdoors 0.52%
Pets & Animals 0.49%

ROAS by Industry

Industry Performance 2026
Break-even threshold is 1.00 — bar reflects relative return
Industry Median ROAS Bar Performance Signal
Apparel & Accessories 2.49
Best performer
Home & Garden 1.97
Near break-even threshold
Lifestyle & Boutique 1.88
Competitive
Electronics 1.68
Moderate
Toys, Art, & Collectibles 1.55
Moderate
Sports & Outdoors 1.39
Below average
Below break-even
Beauty 0.74
Below break-even
Health & Wellness 0.72
Below break-even
Food & Beverage 0.49
Poor platform-reported return
Pets & Animals 0.08
Lowest of all industries

Visual and trend-driven industries consistently outperform logic-heavy or low-visual niches. In 2026, industry matters, and creative execution matters even more.

TikTok Ad Rates in 2026

Here is the 2026 breakdown of TikTok’s core advertising costs.

Core Ad Rates of TikTok at a Glance 

Ad Rates 2026
Metric Rate
Cost Per Click (CPC) $0.30 - $1.50
Cost Per Mille / CPM $5.00 - $12.00
Cost Per Engagement (CPE) $0.01 - $0.07
Cost Per App Install (CPI) $0.50 - $1.80

Budget Allocation Framework 

Budget Strategy
Budget Bucket % Allocation Purpose
Proven Winners 70% Campaigns with established positive ROAS
Testing 20% New creatives, audiences, ad formats
Experiments 10% Retargeting, new platforms, innovative approaches

Recommended Daily Budget by Stage 

Budget Planning
Stage Daily Budget
Initial testing $20 - $50 / day per campaign
Scaling (after optimization) $100 - $200 / day

Ad Rates by Campaign Objective 

Cost by Objective
Campaign Objective Rate
Awareness $4.00 - $10.00 CPM
Traffic $0.40 - $1.20 CPC
Conversions (purchases / leads) $1.00 - $2.50 CPC
App Installs $0.50 - $1.80 per install
Engagement $0.01 - $0.07 per interaction

Ad Rates by Industry 

Industry CPC CPM
E-Commerce & Retail $0.50 – $1.50 $6.00 - $12.00
Mobile Apps & Gaming - $0.50 - $1.80 CPI
Service-Based Businesses $0.40 - $1.20 $5.00 - $10.00
B2B Campaigns $1.50 - $3.00 -

Seasonal CPM Fluctuations 

Period CPM Impact
Q4 Holidays (Black Friday, Cyber Monday, Christmas) 20-40% / up to $15-$20 CPM in competitive niches
Back-to-School (late July - September) Increased costs
Valentine's Day & Mother's Day Temporary increase in relevant categories
Off-Peak (January - March, June - August) 15-30% lower CPMs

Learn more about TikTok Ad rates in detail here.

Is TikTok Advertising Worth It in 2026?

Based on TikTok ads statistics, it’s definitely yes. But only if you treat it as a content platform, not a traditional ad channel.

Engagement rates are strong, eCommerce returns are competitive, and the brands that win run native-style creatives, test frequently, and give the algorithm enough budget to optimize.

Start small, run multiple creative variations, and measure against the benchmarks in this guide.

If you properly implement TikTok ad strategy, it is not just an experimental channel. It is a reliable revenue engine.

To help you, Uproas provides enterprise-level TikTok Agency Ad Accounts, allowing high-volume brands to scale without the restrictions of standard self-serve accounts.

For Serious Advertisers
Put These Benchmarks to Work

Now that you know the numbers, you need the infrastructure to match them. Uproas TikTok Agency Ad Accounts give you higher limits, dedicated support, and faster scaling.

Yes Higher spend limits    Yes Fewer restrictions    Yes Enterprise support

Get Your TikTok Agency Account →
No contracts. Cancel anytime.

FAQs

How long does TikTok ad approval usually take?
+
Most ads are cleared within 24 hours. During peak review periods, it may take up to 48 hours, so submit ads early to avoid campaign delays.
Can you run TikTok ads without a TikTok account?
+
Yes. You do not need a personal or brand profile to run ads. You can manage everything through the TikTok Ads Manager platform instead.
What video aspect ratio works best for TikTok ads?
+
Use Vertical (9:16). This format fills the entire phone screen, which feels natural to users and keeps them from scrolling past your ad.
Does TikTok support retargeting website visitors?
+
Yes. By adding the TikTok Pixel to your site, you can show ads to people who have already visited your store or viewed your products.
Can you run TikTok ads in every country?
+
Not yet. While TikTok Ads Manager is available in many major regions, some countries are still restricted due to local laws or platform limits. Always check availability before launching campaigns in a new region.
Mark Voronov
about the author

Mark Voronov

Mark is a creative strategist with a deep understanding of what makes ads convert. With over $30M in managed Facebook ad spend, he knows the real levers behind performance—and he's here to share them. At Uproas.io, Mark helps brands cut through the noise with data-backed creative direction and a strategic edge. On the blog, he uncovers what’s really beneath the surface of digital advertising—from ad psychology to scalable systems that work.

Mark is a creative strategist with a deep understanding of what makes ads convert. With over $30M in managed Facebook ad spend, he knows the real levers behind performance—and he's here to share them. At Uproas.io, Mark helps brands cut through the noise with data-backed creative direction and a strategic edge. On the blog, he uncovers what’s really beneath the surface of digital advertising—from ad psychology to scalable systems that work.
Read more >

Latest blogs

TikTok Ads Statistics 2026: Benchmarks, Rates and Performance Data
ADS

TikTok Ads Statistics 2026: Benchmarks, Rates and Performance Data

With 8.7M businesses competing, discover key TikTok ads statistics and different benchmarks to beat the competition and refine your ad performance.

Read how >
Static vs Dynamic Ads: Key Differences, Examples & How to Choose in 2026
ADS

Static vs Dynamic Ads: Key Differences, Examples & How to Choose in 2026

Compare static and dynamic ads, their key differences, examples, and when to use each format to improve targeting, conversions, and ROI in 2026.

Read how >
Geographic Segmentation: Definition, Variables, Examples & How Marketers Use It
ADS

Geographic Segmentation: Definition, Variables, Examples & How Marketers Use It

Stop wasting ad spend on guesswork. Geographic segmentation uses location data to reach the right audience at the right place and drive real ROI.

Read how >
How to Manage Multiple Facebook Accounts on One Device
Facebook Account

How to Manage Multiple Facebook Accounts on One Device

Learn how to manage multiple Facebook accounts on one device safely using browser isolation, account separation, AdsPower, and Uproas tools.

Read how >
Bing vs Google Ads: Which Advertising Platform Is Better in 2026?
ADS

Bing vs Google Ads: Which Advertising Platform Is Better in 2026?

Confused between Bing vs Google ads? Learn the key differences, including cost, reach, and performance. Pick the right ad platform for your business.

Read how >
7 Best Klaviyo Agencies for Ecommerce Brands in 2026
LISTICLE

7 Best Klaviyo Agencies for Ecommerce Brands in 2026

Looking for a reliable Klaviyo email marketing agency for your ecom business? Here is our list of 7 best Klaviyo agencies for e-commerce you should consider.

Read how >
ROAS Benchmarks: Industry, Platform & Profitability Data (2026 Guide)
ADS

ROAS Benchmarks: Industry, Platform & Profitability Data (2026 Guide)

Master ROAS benchmarks with this 2026 guide. Get industry, platform (Google, Meta, TikTok, Amazon), and profitability data, plus how to set your own targets.

Read how >
Facebook Users Statistics (2026): Global Numbers, Demographics, Growth & Trends
FACEBOOK

Facebook Users Statistics (2026): Global Numbers, Demographics, Growth & Trends

Find out the most intriguing Facebook users statistics in 2026 including MAUs, DAUs, demographics and key insights related to engagement and ads.

Read how >
Best Sites to Buy Old Facebook Accounts in 2026
LISTICLE

Best Sites to Buy Old Facebook Accounts in 2026

Looking to buy an old Facebook account? Here is the list of the 7 best providers of high-quality, aged Facebook accounts you should consider.

Read how >
Increase Your Facebook Feedback Score — Guaranteed
Bulletproof your Business Manager and unlock unrestricted scaling with our guaranteed Facebook Feedback Score enhancement.
icon check
Get Lower CPMs
icon check
Get Higher Quality Traffic
icon check
Avoid Restrictions and Bans
icon check
Real GEO Targeted Profiles
No bots
Check Availability
Message us to get started
Chat with Uproas on TelegramChat with Uproas on WhatsApp
footer graph

Subscribe to our newsletter

Get a summary of what we’ve shipped during the last month, behind the scenes updates, and team picks.

Thank you for subscribing!
Something went wrong. Please try again.
partner logopartner logopartner logo
users love usg2